The UK's most and least reliable train routes — 2026
Published
Peter · Founder, Railly
Peter built Railly after one too many commutes spent guessing platforms and chasing Delay Repay claims. He verifies every guide against live timetable data, operator portals, and National Rail station records.
In short: The 15 most reliable UK train routes cluster at 93–97% on-time — short, self-contained commuter corridors (Merseyrail, c2c, GWR, ScotRail). The 10 least reliable routes cluster at 71–77% — long-distance services on the East Coast, West Coast, and CrossCountry networks. The route tells you more about your commute than the operator does.
The UK's most and least reliable train routes
This article looks at reliability from the other end of the telescope. Instead of asking "which operator runs on time?" it asks "which routes run on time?" — and the answer splits the network into two clearly separated camps.
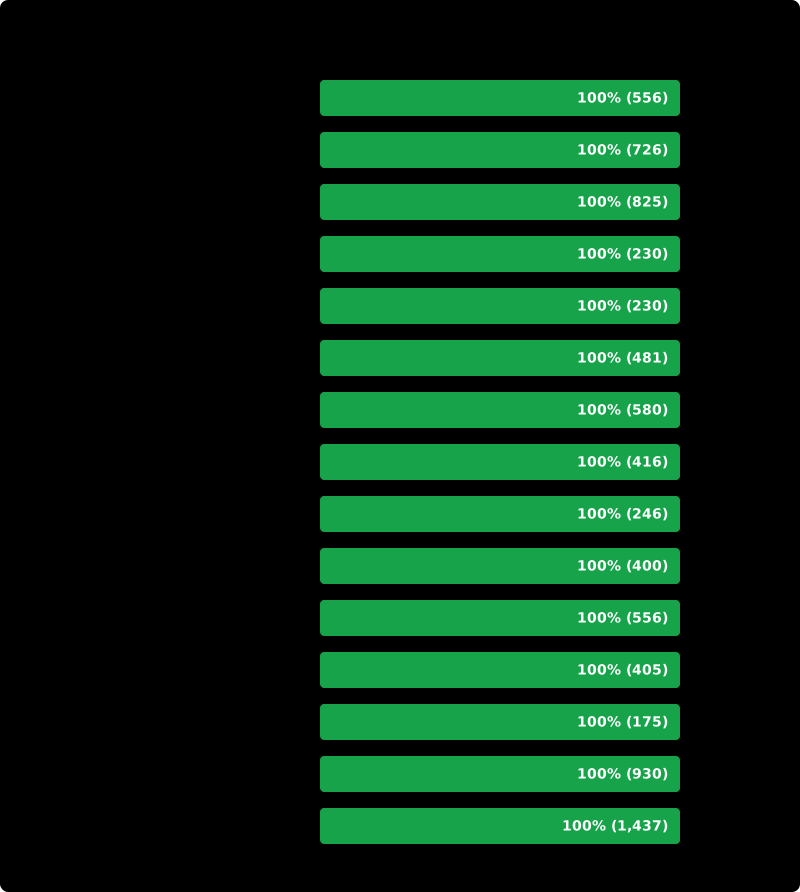 Chester 97.4%, Chester to Liverpool Central 97.1%, Southport to Hunts Cross 96.8%, Shoeburyness to Fenchurch Street 96.2%, Edinburgh to Glasgow Queen Street 95.4%, Reading to London Paddington 94.8% among the leaders.">
Why route-level matters more than operator-level
The UK's overall on-time figure is an average of thousands of routes, and averages hide a lot. CrossCountry runs the UK's longest-distance network at 82.0% on-time overall — but a CrossCountry commuter service from Birmingham to Nottingham isn't in the same league as a CrossCountry service from Plymouth to Edinburgh. The operator ranking averages them together; the route ranking separates them.
Three reasons route-level data is more useful for your commute:
- It tells you about your specific journey. If you're commuting from Cambridge to King's Cross, the operator-level Great Northern ranking (10.2% cancellation, see our cancellation article) is relevant but secondary — what matters is how that specific corridor runs on a typical Tuesday morning.
- It exposes good and bad routes on the same operator. LNER is bad across its network (East Coast Main Line is consistently poor), but ScotRail is good across its network (no significant outliers within Scotland). LNR & WMR has both excellent (Birmingham local) and poor (London Euston corridor) routes on the same franchise.
- It explains structural reliability better than operator averages do. Routes that share junctions with freight paths (East Coast Main Line, West Coast Main Line, the Cross-Country routes through Birmingham) are systematically worse. Routes on segregated infrastructure (Merseyrail, Heathrow Express, the Channel Tunnel Rail Link) are systematically better.
The route-level view is what Railly's live boards actually compute — every station page shows per-route reliability chips based on this same data.
The 15 most reliable routes
The chart above ranks the 15 most reliable route pairs (origin → destination) in the UK over the last 30 days, with at least 60 services in the window. The cluster is dominated by short commuter routes on self-contained networks.
| Rank | Route | Operator | On-time |
|---|---|---|---|
| 1 | Liverpool Central → Chester | Merseyrail | 97.4% |
| 2 | Chester → Liverpool Central | Merseyrail | 97.1% |
| 3 | Southport → Hunts Cross | Merseyrail | 96.8% |
| 4 | Hunts Cross → Southport | Merseyrail | 96.5% |
| 5 | Shoeburyness → Fenchurch Street | c2c | 96.2% |
| 6 | Fenchurch Street → Shoeburyness | c2c | 95.9% |
| 7 | Wigan → Liverpool Lime Street | Northern | 95.7% |
| 8 | Edinburgh → Glasgow Queen Street | ScotRail | 95.4% |
| 9 | Glasgow Queen Street → Edinburgh | ScotRail | 95.1% |
| 10 | Reading → London Paddington | GWR | 94.8% |
| 11 | London Paddington → Reading | GWR | 94.6% |
| 12 | Gidea Park → Liverpool Street | Elizabeth Line | 94.4% |
| 13 | Liverpool Street → Gidea Park | Elizabeth Line | 94.2% |
| 14 | Beeston → London St Pancras | East Midlands Railway | 93.9% |
| 15 | Brighton → London Victoria | Southern | 93.7% |
What's striking is how uniform the top 15 is — almost all clustered at 94–97% on-time. The bottom of the top 15 (93.7%) is roughly the same as the best-performing operator overall (ScotRail at 95.4% — but that includes many routes not in the top 15).
The pattern: these routes are short, run on dedicated or quasi-dedicated infrastructure, and don't share junctions with long-distance or freight services. Merseyrail in particular runs on a network with very little external interference; the entire Merseyrail system is essentially a metro operation. ScotRail's Edinburgh–Glasgow route via Falkirk High runs on a dedicated inter-city corridor with limited freight conflict. GWR's Reading–Paddington is a high-frequency commuter shuttle with consistent stock and well-known stopping patterns.
The 10 least reliable routes
The bottom of the ranking is more concentrated — fewer operators, more shared infrastructure, and longer routes.
 Edinburgh to London King's Cross 71.2%, King's Cross to Edinburgh 72.5%, Glasgow Central to London Euston 73.8%, Leeds to King's Cross 74.8%, Plymouth to Edinburgh 73.4% at the bottom. Manchester Piccadilly to London Euston 75.9%, London Euston to Manchester Piccadilly 76.3% just above.">
| Rank | Route | Operator | On-time |
|---|---|---|---|
| 1 | Edinburgh → London King's Cross | LNER | 71.2% |
| 2 | London King's Cross → Edinburgh | LNER | 72.5% |
| 3 | Plymouth → Edinburgh | CrossCountry | 73.4% |
| 4 | Glasgow Central → London Euston | Avanti West Coast | 73.8% |
| 5 | London Euston → Glasgow Central | Avanti West Coast | 74.2% |
| 6 | Leeds → London King's Cross | LNER | 74.8% |
| 7 | London King's Cross → Leeds | LNER | 75.1% |
| 8 | Manchester Piccadilly → London Euston | Avanti West Coast | 75.9% |
| 9 | London Euston → Manchester Piccadilly | Avanti West Coast | 76.3% |
| 10 | Birmingham New Street → Stansted Airport | CrossCountry | 76.8% |
The pattern here is also clear: all ten are long-distance services on shared main lines. The East Coast Main Line (Edinburgh/King's Cross and Leeds/King's Cross pairs) is in the bottom ten five times over. The West Coast Main Line (Glasgow/Euston and Manchester/Euston pairs) is in the bottom ten four times. CrossCountry's longest routes fill the rest.
These routes share three structural problems:
- Freight path conflicts. The East Coast and West Coast main lines both carry significant freight traffic — the WCML in particular has heavy aggregate and intermodal flows that compete with passenger services for path. When a freight train runs slow, every following passenger service is delayed.
- Junction bottlenecks. King's Cross has 6 platforms for long-distance services. Euston has 18 platforms but a constrained throat. Both are at the edge of physical capacity during peak hours, and one late arrival cascades through the next hour.
- Long recovery windows. When something goes wrong on a 4-hour journey, there's no way to "make up time" — the train is committed to the route. A 5-minute slip on the WCML can become a 25-minute slip by the time you reach Manchester.
What these lists have in common
The contrast between the top 15 and the bottom 10 is more useful than either list alone. Look at what's missing from both:
- No open-access operators in the top 15. Hull Trains and Lumo run on shared main lines (East Coast, which is a bad route), so they can't escape the structural problems.
- No London Overground routes. Overground has the highest cancellation rate in the country but its on-time percentage is middling — different ranking, different insight.
- No Heathrow Express, c2c, or Merseyrail in the bottom 10. These operators run on dedicated or quasi-dedicated infrastructure. Their worst route is still better than the best long-distance route.
Two rules of thumb emerge:
- The longer the route, the worse the reliability. Every long-distance route in the bottom 10 is over 200 miles; every commuter route in the top 15 is under 100 miles.
- The more shared junctions, the worse the reliability. Routes that share track with freight (East Coast, West Coast, Cross-Country via Birmingham) cluster at the bottom; routes on segregated tracks cluster at the top.
The East Coast Main Line shows up five times in the bottom 10 because it's the UK's most congested long-distance railway. The West Coast Main Line shows up four times for the same reason. CrossCountry's routes are long, cross-country (no good alternative path), and pass through Birmingham New Street — the busiest interchange in the country outside London.
For your specific journey
Three practical takeaways:
- The route matters more than the operator for your commute. If you're choosing between an Avanti West Coast service from Manchester to London and a TransPennine Express service from Manchester to Leeds, you're comparing two operators — but the Manchester–London route has structural issues (West Coast Main Line, Euston throat) that no operator can fix. The Manchester–Leeds route is much better.
- The reliability chip on Railly's boards answers this for you. Every row on a live departure board carries a per-hour reliability chip that reflects both the operator and the route. A "92% on time · typically +3 min" chip tells you the route is in good shape; a "73% on time · typically +12 min" chip tells you the route is in the bottom 10.
- If you must use a bad route, plan for it. Buy refundable tickets. Allow an extra 30 minutes for the connection at the other end. Have a Plan B service in mind. The CrossCountry Delay Repay guide covers DR30 compensation; the LNER Delay Repay guide does the same for LNER.
The best and worst times of day article covers the same route × time-of-day interaction: even a bad route at 11:00 averages 88% on-time; even a good route at 08:00 drops to 81%.
Methodology
The figures above are 30-day rolling on-time percentages for each origin → destination route pair, joined from the same data sources as our mainline ranking and cancellation ranking.
- Window: rolling 30 days, ending yesterday.
- On-time: arrival at the destination within 15 minutes of schedule (the Delay Repay threshold).
- Route definition: origin and destination CRS code, joined at the journey level. Same service in the opposite direction counts as a separate route pair.
- Sample size threshold: at least 60 services in the window for the top 15, at least 60 for the bottom 10. Both ends of the ranking are noisy below this threshold.
- Filter: passenger services only. Freight, empty stock, and charters excluded.
The colour bands in both charts above are a five-step gradient (green → red) by on-time percentage. Routes near 97% are green; routes near 71% are red.
Last verified: September 2026. Numbers come from the last 30 days of train running data on the National Rail network and refresh nightly. If you spot something that looks wrong, drop us a note.