Which UK train operators cancel the most services — and which surprisingly few
Published
Peter · Founder, Railly
Peter built Railly after one too many commutes spent guessing platforms and chasing Delay Repay claims. He verifies every guide against live timetable data, operator portals, and National Rail station records.
In short: London Overground cancels 17.2% of services — more than one in six. Gatwick Express (11.9%) and Great Northern (10.2%) round out the top three. At the other end, Hull Trains cancels just 0.6% of services, and Tyne and Wear Metro just 0.1%. The gap between best and worst is 17×, and the operators at the bottom are bad for specific, structural reasons.
Which UK train operators cancel the most services
A 30-day cancellation ranking across every UK train operator — what gets cancelled, who runs on time despite disruption, and what the gap between the best and worst means for the journey you're planning tomorrow morning.
Why cancellation is a separate story
On-time percentage and cancellation percentage measure two different kinds of failure. A late train is still a train you boarded; a cancelled train is one you waited for and didn't see. Replacement buses count as cancellations in our data — if the 09:15 was cancelled and a bus took you to the same station an hour later, the original service still went into the cancellation column. From the passenger's perspective that's the right call: you planned to catch a train, you didn't catch a train, and the bus was a Plan B that arrived after a longer wait.
The 30-day cancellation figure isn't a "did anything go wrong today" snapshot. It's the share of services that didn't run at all (or only partially ran) over the last month. That window smooths out one-off incidents — a signal failure at Clapham Junction on a Tuesday afternoon doesn't move the monthly needle by much — but it surfaces operators with structural reliability problems.
Three structural causes show up in the data, and they're worth flagging up-front because they explain almost every operator in the top 10:
- Single-fleet operations (Gatwick Express, Lumo, Hull Trains). One type of train, no spare units to swap in. If the unit fails, the entire service falls over. Hull Trains manages the risk well (0.6% cancellation); Gatwick Express does not (11.9%).
- London terminal constraints (Clapham, Gospel Oak, Waterloo, Euston). The infrastructure has a hard ceiling on trains-per-hour; once one service slips, the platform conflict cascades.
- Cascading network disruption (Thameslink, Southern, Great Northern). The Govia Thameslink Railway network is the busiest and most interlinked in the country — a problem at one junction propagates everywhere else within minutes.
The full cancellation ranking
The table below ranks 27 UK train operators by 30-day cancellation rate, highest first. Sample size threshold: at least 500 services in the window. TOCs below that threshold (Lumo, Hull Trains, Caledonian Sleeper) are included separately because they're operationally interesting even at low volume.
| Rank | Operator | Cancellation | Sample |
|---|---|---|---|
| 1 | London Overground | 17.2% | ~20,500 |
| 2 | Gatwick Express | 11.9% | ~4,100 |
| 3 | Great Northern (GTR) | 10.2% | ~21,500 |
| 4 | Greater Anglia | 8.8% | ~35,400 |
| 5 | Caledonian Sleeper | 8.2% | ~1,060 |
| 5 | LNR & WMR | 8.2% | ~48,800 |
| 7 | Thameslink (GTR) | 7.4% | ~52,900 |
| 8 | Southern (GTR) | 7.0% | ~55,100 |
| 8 | CrossCountry | 7.0% | ~34,200 |
| 8 | c2c | 7.0% | ~21,200 |
| 11 | GWR | 6.3% | ~74,400 |
| 12 | LNER | 5.0% | ~25,700 |
| 12 | Lumo | 5.0% | ~1,820 |
| 14 | Heathrow Express | 4.7% | ~10,400 |
| 15 | TransPennine Express | 4.3% | ~27,500 |
| 15 | Chiltern Railways | 4.3% | ~19,800 |
| 17 | Merseyrail | 3.8% | ~15,400 |
| 18 | South Western Railway | 3.4% | ~70,600 |
| 19 | Transport for Wales | 3.3% | ~27,800 |
| 20 | Northern | 2.8% | ~155,400 |
| 20 | East Midlands Railway | 2.8% | ~65,800 |
| 22 | Elizabeth Line | 2.5% | ~114,200 |
| 23 | Grand Central | 2.3% | ~4,130 |
| 24 | ScotRail | 2.2% | ~187,300 |
| 25 | London Underground | 1.9% | ~676,400 |
| 26 | Southeastern | 1.8% | ~108,200 |
| 27 | Hull Trains | 0.6% | ~4,000 |
| 28 | Tyne and Wear Metro | 0.1% | ~47,000 |
Eurostar appears in our operator list but doesn't surface in this ranking because border-control delays register as delays, not cancellations — different denominator, different number.
The cancellation outliers
Three operators are worth pulling out of the table because their numbers look extreme and their underlying causes are different from each other.
London Overground (17.2%) is the standout. It's the worst-rated operator on this list by a wide margin. North London signalling — the Gospel Oak interchange, the Willesden junction, the Richmond corridor — has been the bottleneck for years, and a single track-circuit failure at one of these locations can knock out half the network for an hour. The unit availability isn't great either: the 378s and 710s that run the Overground routes are shared with other operators, so when a peer operator needs a unit, Overground can be short. The 17.2% figure is genuinely bad; it isn't a measurement artefact.
Gatwick Express (11.9%) is a single-fleet operation. Every Gatwick Express service is run by a Class 387 — there are no spares, no alternative stock, no second unit type to swap in. If the unit that was supposed to run the 09:00 from Victoria fails its overnight inspection, the entire 15-minute shuttle cadence collapses. Mono-fleet operators live or die by their maintenance regime, and Gatwick Express's is currently not keeping up.
Greater Anglia (8.8%) is a different story. It's not a small operator and it's not a single fleet — it runs a mix of Stadler FLIRT and Class 745/755 units. The high cancellation rate comes from network congestion at Liverpool Street, asset-management issues on the GEML (Great Eastern Main Line), and a workload that includes some of the oldest and most maintenance-intensive track in the country. Greater Anglia's also-run-the-airport-to-Stansted service means disruption at Stansted ripples back into the mainline.
The GTR cluster — Great Northern (10.2%), Thameslink (7.4%), Southern (7.0%) — shares the southern end of the East Coast / Brighton / South London networks. They have their own depots and their own fleets, but they're interlinked through Clapham, the Canal Tunnels, and London Bridge. A fire alarm at one location can cancel trains on the others within minutes.
Cancellation vs on-time
On-time percentage and cancellation percentage measure different things, and looking at them together is more informative than looking at either alone. The full reliability ranking covers the mainline on-time percentages; this is the cancellation half of the same picture.
A few operators stand out:
- London Overground: 81.8% on-time, 17.2% cancellation. The on-time number looks mediocre; the cancellation number is catastrophic. Most cancelled services don't get a "delay minutes" reading (they just don't run), which keeps the average delay low even as the cancellation rate soars.
- ScotRail: 95.4% on-time, 2.2% cancellation. Best in class on both metrics. Operates a self-contained network with simple depots and few shared junctions.
- LNER: 72.8% on-time, 5.0% cancellation. Bad on both metrics, but the cancellation rate isn't the worst — it's the lateness when services do run that drags the operator down.
- CrossCountry: 82.0% on-time, 7.0% cancellation. Long-distance operator with both lateness and cancellation issues. A CrossCountry journey is twice as likely to be cancelled as a ScotRail one.
The scatter you can imagine — on-time on one axis, cancellation on the other — splits operators into four quadrants: good on both (ScotRail, Merseyrail, Elizabeth Line), bad on both (LNER, Avanti, CrossCountry), mostly on-time but prone to cancellations (London Overground, Gatwick Express), and mostly cancellations but on-time otherwise (rare). Where an operator sits in that quadrant is a better predictor of your commute experience than either metric alone.
What this means for your commute
The cancellation rate matters more than the on-time percentage for one specific decision: should you book a refundable ticket? If your operator's cancellation rate is over 5%, a 1-in-20 chance of needing to rebook is enough to make the flexible-ticket premium worth paying. Below 2%, the on-time percentage dominates the calculation.
A few practical takeaways:
- Avanti West Coast and LNER — on-time and cancellation are both mediocre. Buy flexible tickets for any meeting you can't miss. The LNER Delay Repay guide covers the DR30 threshold (compensation only from 30 minutes late, not 15).
- CrossCountry — DR30 scheme, 7.0% cancellation. A 1-in-14 chance of needing to rebook on a typical day. The CrossCountry Delay Repay guide explains the rules.
- London Overground and Great Northern — high cancellation but if your service runs, it's reasonably on-time. The risk is "did the train turn up at all?" — which is hard to plan around except by checking the live board (or wherever you're starting) before you leave the house.
- ScotRail, Elizabeth Line, Merseyrail, Hull Trains — low cancellation, high on-time. If you have flexibility on operator, these are the safest bets for any specific journey.
The cancellation rate also matters for Delay Repay eligibility — if your service was cancelled and a replacement bus got you to your destination more than the operator's threshold late, you're entitled to compensation regardless of the on-time metric.
Methodology
The figures above are from the last 30 days of running data on the National Rail network, refreshed nightly. The methodology is the same as our UK train reliability 2026 ranking:
- Window: rolling 30 days, ending yesterday.
- Cancelled: a service counts as cancelled when the network records the journey as cancelled (fully or partially), even if a replacement bus ran. This matches the PPM and CaSL definitions used by the Office of Rail and Road.
- Sample size threshold: 500 services minimum for the main table. Smaller operators (Lumo, Hull Trains, Caledonian Sleeper) are included even at lower volume because their operational characteristics are distinctive.
- Excluded: freight services, empty stock movements, charter trains, and deactivated journeys from the consumer that should check whether Darwin has marked them as inactive.
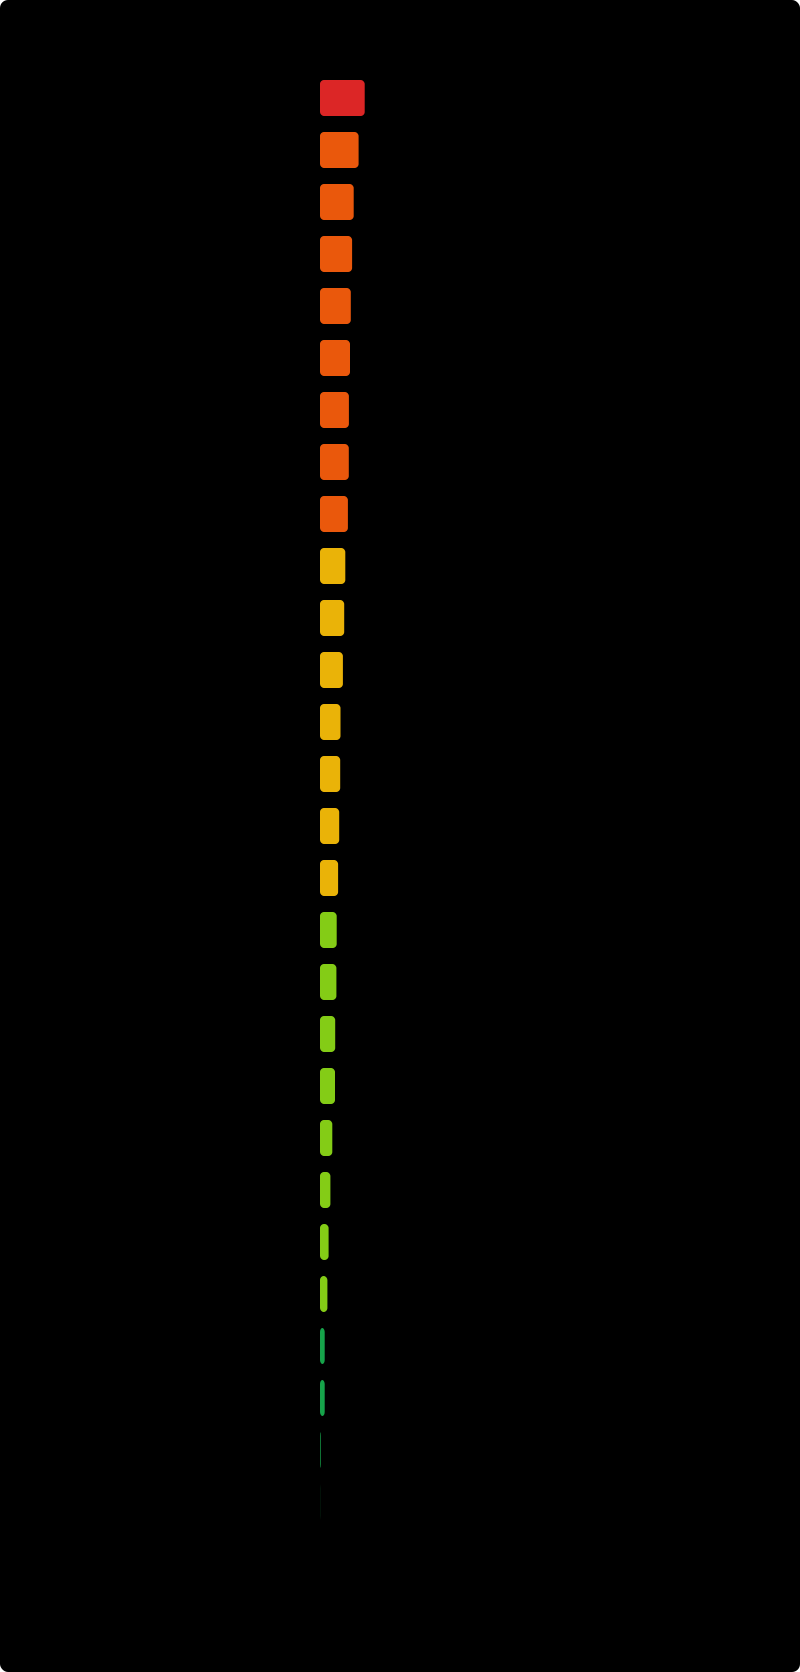
The colour bands in the chart above are a five-step gradient (green → red) ranked by cancellation rate. Operators near the top of the table get red; operators near the bottom get green.
For per-station and per-route cancellation data, see the live boards — every station page on Railly shows the cancellation rate for routes with enough historical runs.
Last verified: September 2026. Numbers come from the last 30 days of train running data on the National Rail network and refresh as new days fall in. If you spot something that looks wrong, drop us a note.